


Weekly Market Updates
Investment Strategy: “The 7% Solution”
We have long been big fans of the books about Sherlock Holmes ever since our misbegotten youth. Strangely enough, being a strategist/analyst is much like being a detective. One has to gather the evidence, pour through it, decipher it, eliminate the “noise,” and come to a conclusion that tips the odds of making money in our favor. We have been doing that professionally for 47 years and investing with our father for over 54 years. We have made a number of bad “calls,” yet in this business when you take a stand and make a “call,” you are going to make mistakes. As often stated, “When you are wrong you say you are wrong and you say it quickly for a de minimis loss of capital,” a trait not many have in this business. That said, our correct
“calls” have vastly outweighed our bad “calls.” Most recently, we noted that our short/intermediate proprietary models, after being constructive for a REALLY long time, were targeting early to mid-February as a point of downside vulnerability (bear in mind that our models have a plus/minus three-session variability). Accordingly, the Dow Dive began last Monday (1- 29-18) exactly three sessions before the beginning of February. Subsequently, the senior index has surrendered over 3% from the recent all-time highs. Yet as one of our financial advisors emailed me last Friday, “You didn’t tell us it was going to be this bad!” “Really,” 3.9% off of the highs and we get bombarded with comments like that.
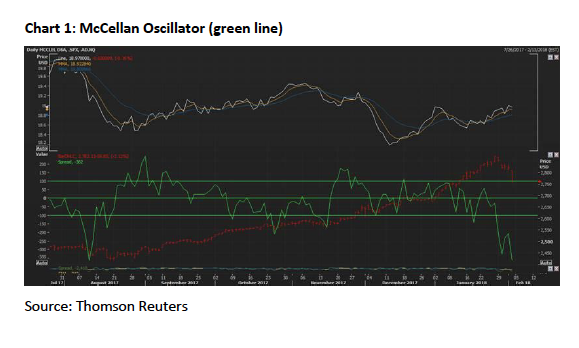
Another question was, “How far can this decline go?” Such questions caused us to pull up a chart of the S&P 500 (SPX/2762.13) to look for what would seem to be a reasonable support level for the SPX. Before we forget, remember, our models do not tell us how far a decline, or rally, will go. All they tell us is the equity markets are nearing either a point of vulnerability, or a point for a decent rally. Nevertheless, studying the chart reveals there are a number of support levels. There is a gap in the SPX chart at 2767, 2750, 2736, 2723, and 2714, which could represent support. However, 2672 would be a 7% pullback from the peak that should find major support at the mid-December 2017 lows, aka “The 7% Solution.” To be sure, that would be enough to spook the majority of participants and represent a decent point of entry. That said, there could be some kind of throwback attempt this week since the McClellan Oscillator is extremely oversold (Chart 1), but we would not trust it.
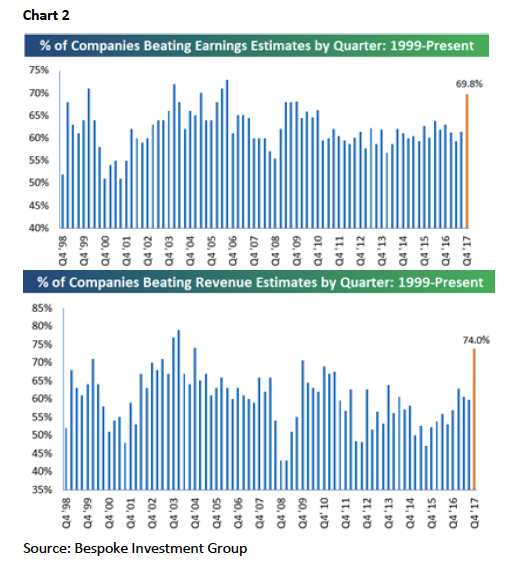
Moving on to earnings, since in the long run it is all about earnings, earnings and revenues remain pretty good. Recall, we suggested the equity markets had transitioned from an interest rate driven market to an earnings driven bull market in the back-half of 2016 (Chart 2). BINGO that is exactly what happened. Therefore we were quite interested in these comments from our friend, CNBC’s Bob Pisani last Friday:
Half of the S&P will have reported by the end of the day today, and it is turning into an extraordinary quarter. Earnings are up nearly 15% from the same period a year ago, and keep rising, according to Thomson Reuters. That is a blended estimate, and includes companies that have not reported yet. If you just count the companies that have already reported, the actual earnings are up 17.3%. That would be the highest growth since the third quarter of 2011. Far more are beating estimates (nearly 80%) than the average (64%), and they are beating by a wider margin.
Most importantly, revenue growth has returned. The earnings gains are no longer coming primarily from cost cutting: revenue growth, at 8.0 percent, is the highest since the third quarter of 2011, and 82% are beating the revenue estimates (also far higher than the 60% average). As with earnings, they are beating by a wider margin (6.1 percent), more than twice the average of 3.1 percent.
After last Friday’s Flop the sagacious Bob Pisani wrote this:
The selloff: is there a catalyst for a deeper correction? The S&P is only 3.9% from its historic high, but traders are already debating whether there could be a deeper correction coming. For the moment, the bears have the upper hand. They cite: 1) the surge in wages (up 2.9% year-over-year, highest since 2009), 2) a sudden acceleration in bond yields (from 2.5% to over 2.8% in three weeks), that is already affecting key areas of the market (the Homebuilding ETF (XHB) is down 10 percent in the past week and a half) 3) a dollar that has stabilized and showing signs of strengthening, and 4) investor sentiment that is at multiyear extremes (the BofA Merrill Lynch Bull & Bear indicator is at the highest level since March 2013; the Goldman Bull/Bear Market Indicator is at the highest level in 10 years)
The bulls argue this is no time to panic, that the macro environment is still nearly perfect, and that a “tradeable correction” (market down 5%) will bring out plenty of buyers. Joe Zicherman of Stadium Capital told me that a good placemark is the 50-day moving average in the S&P 500, currently around 2,716, about 50 points below where market is now. Hitting that would be a decline of about 6% from the historic high of 2,872 we hit on January 26th. For
everyone who keeps saying they would love to buy the markets 5 percent lower, that’s a good number to keep in mind.
The call for this week: “Never on a Friday” is a mantra we came up with years ago meaning that once the equity markets get into one of these downside skeins they typically do not bottom on a Friday. It gives participants time over the weekend to brood about their losses and then they “show up” in sell-mode on Monday/Tuesday leading to Turning Tuesday. With the McClellan Oscillator EXTREMELY oversold we would look for some kind of throwback rally attempt early this week.
Regrettably, we do not think it will stick. And, then there was this from the eagle-eyed Jason Goepfert of SentimenTrader fame:
- 4 standard deviations. Friday’s decline was 4 standard deviations from the average move over the past year. We don’t often see a move that extreme so close to what had been a new high in the indexes, the last one occurring in February 2007.
- Worst week in years. The S&P’s week was the worst in well more than a year, following a week when it had been at a new high. Other times it reversed like this, it rebounded every time over the medium term, with extremely positive risk/reward ratios.
- Another streak gone. The drop was enough to end the S&P’s longest-ever stretch without a 3% pullback from a high.
- Finally, a little fear. The VIX jumped more than 25% while the S&P managed to hold above its 50- and 200-day averages, and there was also record high volume in inverse ETFs.
- The latest Commitments of Traders report was released, covering positions through
PS – The worst set of TV Super Bowl commercials of my life!
Important Investor Disclosures
Raymond James & Associates (RJA) is a FINRA member firm and is responsible for the preparation and distribution of research created in the United States. Raymond James & Associates is located at The Raymond James Financial Center, 880 Carillon Parkway, St. Petersburg, FL 33716, (727) 567-1000. Non-U.S. affiliates, which are not FINRA member firms, include the following entities that are responsible for the creation and distribution of research in their respective areas: in Canada, Raymond James Ltd. (RJL), Suite 2100, 925 West Georgia Street, Vancouver, BC V6C 3L2, (604) 659-8200; in Europe, Raymond James Euro Equities SAS (also trading as Raymond James International), 40, rue La Boetie, 75008, Paris, France, +33 1 45 64 0500, and Raymond James Financial International Ltd., Broadwalk House, 5 Appold Street, London, England EC2A 2AG, +44 203 798 5600.
This document is not directed to, or intended for distribution to or use by, any person or entity that is a citizen or resident of or located in any locality, state, country, or other jurisdiction where such distribution, publication, availability or use would be contrary to law or regulation. The securities discussed in this document may not be eligible for sale in some jurisdictions. This research is not an offer to sell or the solicitation of an offer to buy any security in any jurisdiction where such an offer or solicitation would be illegal. It does not constitute a personal recommendation or take into account the particular investment objectives, financial situations, or needs of individual clients. Past performance is not a guide to future performance, future returns are not guaranteed, and a loss of original capital may occur. Investors should consider this report as only a single factor in making their investment decision.
For clients in the United States: Any foreign securities discussed in this report are generally not eligible for sale in the U.S. unless they are listed on a U.S. exchange. This report is being provided to you for informational purposes only and does not represent a solicitation for the purchase or sale of a security in any state where such a solicitation would be illegal. Investing in securities of issuers organized outside of the U.S., including ADRs, may entail certain risks. The securities of non-U.S. issuers may not be registered with, nor be subject to the reporting requirements of, the U.S. Securities and Exchange Commission. There may be limited information available on such securities. Investors who have received this report may be prohibited in certain states or other jurisdictions from purchasing the securities mentioned in this report.
Please ask your Financial Advisor for additional details and to determine if a particular security is eligible for purchase in your state.
The information provided is as of the date above and subject to change, and it should not be deemed a recommendation to buy or sell any security. Certain information has been obtained from third-party sources we consider reliable, but we do not guarantee that such information is accurate or complete. Persons within the Raymond James family of companies may have information that is not available to the contributors of the information contained in this publication. Raymond James, including affiliates and employees, may execute transactions in the securities listed in this publication that may not be consistent with the ratings appearing in this publication.
Raymond James (“RJ”) research reports are disseminated and available to RJ’s retail and institutional clients simultaneously via electronic publication to RJ’s internal proprietary websites (RJ Investor Access & RJ Capital Markets). Not all research reports are directly distributed to clients or third-party aggregators. Certain research reports may only be disseminated on RJ’s internal proprietary websites; however such research reports will not contain estimates or changes to earnings forecasts, target price, valuation, or investment or suitability rating. Individual Research Analysts may also opt to circulate published research to one or more clients electronically. This electronic
communication distribution is discretionary and is done only after the research has been publically disseminated via RJ’s internal proprietary websites. The level and types of communications provided by Research Analysts to clients may vary depending on various factors including, but not limited to, the client’s individual preference as to the frequency and manner of receiving communications from Research Analysts. For research reports, models, or other data available on a particular security, please contact your RJ Sales Representative or visit RJ Investor Access or RJ Capital Markets.
Links to third-party websites are being provided for information purposes only. Raymond James is not affiliated with and does not endorse, authorize, or sponsor any of the listed websites or their respective sponsors. Raymond James is not responsible for the content of any third-party website or the collection or use of information regarding any website’s users and/or members.
Additional information is available on request.